
XRF vs XRD: What Each Technique Actually Measures
X-ray fluorescence (XRF) and X-ray diffraction (XRD) both use X-rays, but they measure different physical phenomena. XRF answers elemental-chemistry questions. XRD answers crystalline-phase and crystal-structure questions. The sections below explain what that difference means in practice and where the two techniques complement each other.
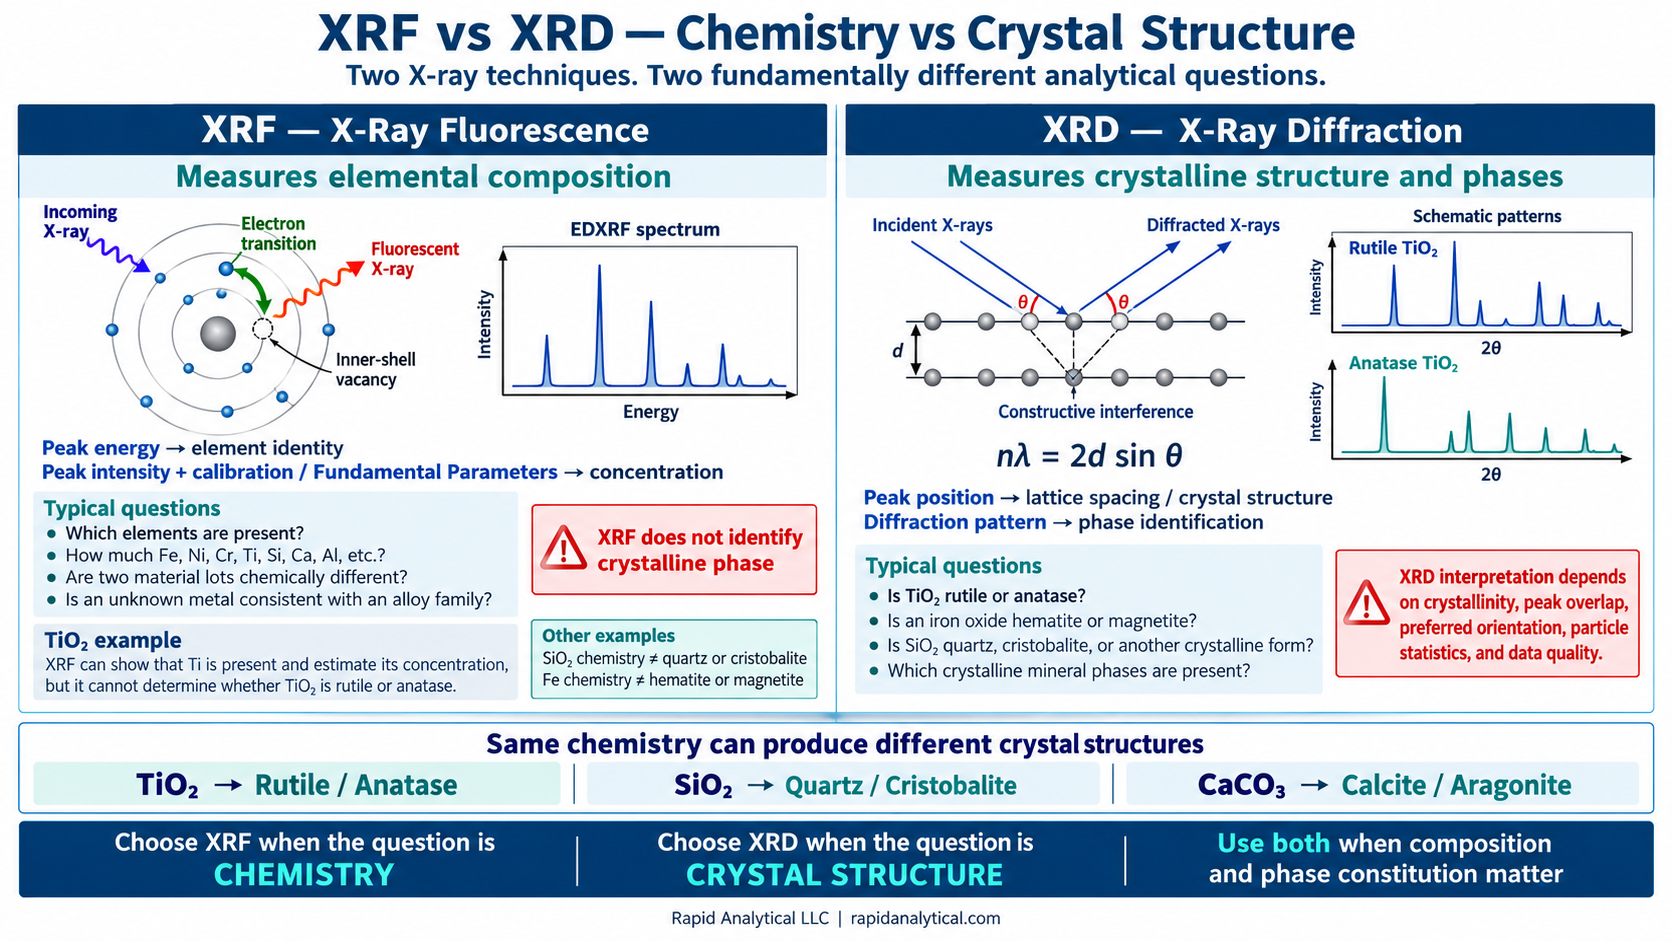
What XRF Actually Measures
XRF begins when incident X-rays ionize inner-shell electrons in atoms within the sample. Electrons from higher energy levels fill those vacancies and emit characteristic fluorescent X-rays. The photon energy identifies the element, while the net characteristic-line intensity is related to the amount of that element present.
In energy-dispersive XRF (EDXRF), such as the Thermo Scientific ARL™ QUANT’X used by Rapid Analytical, the detector records an energy spectrum. Peak positions provide elemental identification, while peak intensities are interpreted quantitatively or semi-quantitatively using empirical calibration, Fundamental Parameters, or a combination of both.
Why XRF intensity is not simply equal to concentration: primary X-rays and emitted fluorescent X-rays are absorbed differently by different matrices, and fluorescence from one element can enhance another element’s signal. These absorption and enhancement effects are the core matrix effects described by the Sherman formulation. Quantitative XRF therefore requires matrix correction rather than a simple peak-height-to-concentration conversion.
XRF is well suited to questions such as:
- Which elements are present in an unknown inorganic material?
- How do Fe, Ni, Cr, Ti, Si, Al, Ca, or other measurable elements compare between samples?
- Are two supplier lots chemically different?
- Is an unknown metal chemically consistent with a suspected alloy family?
- Did a process step change elemental composition or introduce contamination?
What XRD Actually Measures
XRD measures coherent diffraction from periodically arranged atoms in a crystalline lattice. Constructive interference occurs when the diffraction condition described by Bragg’s law is satisfied:
Here, λ is the X-ray wavelength, d is the spacing between crystallographic planes, and θ is the diffraction angle. A crystalline phase produces a characteristic set of diffraction peaks. Peak positions reflect lattice spacings and crystal structure, while the full diffraction pattern can be used for phase identification and, with an appropriate model, quantitative phase analysis.
Depending on the data quality and analytical method, powder XRD can provide information about:
- crystalline-phase identification;
- quantitative crystalline-phase fractions;
- lattice parameters and structural changes;
- preferred orientation (texture);
- crystallite-size and microstrain contributions to peak broadening; and
- broad scattering associated with amorphous or poorly ordered material.
Quantitative XRD is model-dependent. Rietveld quantitative phase analysis uses the full diffraction pattern and phase scale factors. Reliable phase fractions require the relevant crystalline phases to be identified and modeled. Preferred orientation, microabsorption, peak overlap, particle statistics, crystallite-size broadening, and unmodeled amorphous material can all affect the result.
Same Chemistry, Different Crystal Structure
This is the most important reason XRF and XRD should not be treated as interchangeable. Elemental composition does not uniquely determine crystal structure.
| Composition | Possible structures / phases | What distinguishes them? |
|---|---|---|
| TiO₂ | Rutile, anatase, brookite | XRD distinguishes the crystalline phases; XRF mainly establishes Ti-bearing chemistry. |
| Al₂O₃ | α-alumina, γ-alumina and other transition aluminas | XRD reveals structural differences that elemental Al/O chemistry alone cannot. |
| SiO₂ | Quartz, cristobalite, tridymite, amorphous silica/glass | XRD identifies crystalline polymorphs; quantitative amorphous analysis requires an appropriate method. |
| CaCO₃ | Calcite, aragonite, vaterite | XRD separates the crystalline polymorphs. |
Iron oxides are a related but slightly different case. Hematite and magnetite do not have identical stoichiometry, but routine XRF of an iron-rich sample primarily establishes the elemental chemistry and does not determine whether the Fe occurs as hematite, magnetite, another crystalline iron phase, or a combination of phases. XRD is the more appropriate tool for crystalline-phase identification.
The classic rutile/anatase example is especially useful because both phases are TiO₂. XRF can establish the presence and concentration of Ti, but the elemental result alone cannot tell whether the TiO₂ is rutile, anatase, brookite, or a mixture. Powder XRD can distinguish those structures from their different diffraction patterns. Quantitative rutile/anatase XRD methods have been used for decades, including the well-known Spurr–Myers approach.
Why “Oxide wt%” from XRF Does Not Prove an Oxide Phase
XRF fundamentally measures elemental fluorescence. Software may mathematically convert elemental concentrations into oxide-equivalent values such as SiO₂, Al₂O₃, Fe₂O₃, TiO₂, or CaO based on assumed stoichiometry and a selected reporting convention.
A result reported as Fe₂O₃ equivalent does not prove that crystalline hematite is present. Likewise, reporting Ti as TiO₂ does not distinguish rutile from anatase. Oxide-equivalent reporting is a way of expressing elemental chemistry; it is not phase identification.
Conventional XRF also does not directly determine oxidation state. A routine EDXRF result showing Fe does not establish Fe²⁺ versus Fe³⁺. Oxidation-state or local-bonding questions generally require other techniques in addition to, or instead of, conventional XRF and powder XRD.
Why XRF and XRD Can Give Different-Looking Answers on the Same Sample
The two techniques observe different aspects of the material, so an apparent mismatch can be scientifically meaningful rather than an analytical error.
XRF measures total elemental chemistry within the analyzed volume. It does not require an element to be present in a crystalline phase. An element can be distributed among crystalline phases, amorphous material, glass, solid solution, coatings, or multiple minor constituents and still contribute to the XRF signal.
XRD is most sensitive to ordered crystalline material. If some of an element is contained in an amorphous phase or incorporated into a solid solution, it may not appear as a separate crystalline phase in the diffraction pattern.
For example, XRF may show substantial Si in a material while XRD identifies only a limited amount of crystalline quartz. The remaining Si could reside in glass, amorphous silicate, another crystalline silicate phase, or solid solution. The two results are not necessarily inconsistent—they are answering different questions.
Where XRF Has Limitations
- Crystal phase: XRF cannot distinguish polymorphs such as rutile versus anatase or calcite versus aragonite.
- Oxidation state: conventional XRF does not directly determine valence state.
- Light elements: practical sensitivity depends strongly on atomic number, instrument configuration, atmosphere, window/filter conditions, sample matrix, and preparation.
- Matrix effects: absorption and enhancement affect quantitative accuracy and require correction.
- Surface and geometry: coatings, roughness, curvature, particle size, packing density, and sample thickness can influence the measured result.
Where XRD Has Limitations
- Amorphous or poorly crystalline material: lacks sharp long-range-order reflections and may appear mainly as broad scattering.
- Low phase concentration: detectability depends on crystallinity, scattering power, counting statistics, background, peak overlap, and sample preparation; there is no universal XRD phase-detection limit.
- Preferred orientation: can strongly alter relative peak intensities.
- Microabsorption and particle-size effects: can bias quantitative phase analysis in multiphase powders.
- Peak overlap: structurally similar phases can require higher-resolution data or whole-pattern refinement.
- Nanocrystalline materials: size and strain broadening can obscure diagnostically useful peak separation.
Amorphous content requires special care. A broad background feature can indicate non-crystalline material, but it is not automatically an absolute amorphous wt% measurement. Quantitative amorphous analysis generally requires an internal-standard, external-standard, or another validated quantitative approach.
When XRF and XRD Should Be Used Together
For ceramics, minerals, refractories, catalysts, cementitious materials, thermal-spray feedstocks, pigments, and oxide systems, both elemental composition and phase composition can control performance. In those cases, XRF and XRD are complementary:
- XRF: What is the elemental chemistry?
- XRD: How are those atoms arranged into crystalline phases?
Used together, the techniques can provide a stronger materials picture than either alone. XRF constrains the bulk chemistry, while XRD assigns crystalline structures consistent with that chemistry. If the two appear inconsistent, the discrepancy can point toward amorphous material, solid solution, an incomplete phase model, sampling differences, or an unidentified constituent.
Which Test Should Be Chosen?
| If the main question is… | Start with… |
|---|---|
| Elemental composition, alloy chemistry, impurity screening, lot-to-lot chemistry | XRF |
| Rutile vs anatase, calcite vs aragonite, quartz vs cristobalite, or another crystalline-phase question | XRD |
| Elemental chemistry plus phase constitution | XRF + XRD |
| Oxidation state or local chemical bonding | Usually another technique in addition to or instead of conventional XRF/XRD |
| Absolute amorphous fraction | XRD with an appropriate quantitative method, often involving a standard |
Rapid Analytical Currently Provides EDXRF
Rapid Analytical provides elemental analysis using a Thermo Scientific ARL™ QUANT’X EDXRF system. XRD is not currently offered. If the analytical question is primarily elemental composition, XRF may be appropriate. If the decision depends on crystalline-phase identification, polymorph content, or crystal structure, XRD should be performed by a laboratory equipped for diffraction analysis.
Selected Technical References
- Sherman, J. “The Theoretical Derivation of Fluorescent X-Ray Intensities from Mixtures.” Spectrochimica Acta 7 (1955–1956): 283–306. doi:10.1016/0371-1951(55)80041-0.
- Spurr, R. A., and H. Myers. “Quantitative Analysis of Anatase-Rutile Mixtures with an X-Ray Diffractometer.” Analytical Chemistry 29 (1957): 760–762. doi:10.1021/ac60125a006.
- Rietveld, H. M. “A Profile Refinement Method for Nuclear and Magnetic Structures.” Journal of Applied Crystallography 2 (1969): 65–71. doi:10.1107/S0021889869006558.
- Hill, R. J., and C. J. Howard. “Quantitative Phase Analysis from Neutron Powder Diffraction Data Using the Rietveld Method.” Journal of Applied Crystallography 20 (1987): 467–474. doi:10.1107/S0021889887086199.
- Cline, J. P., R. B. Von Dreele, R. Winburn, P. W. Stephens, and J. J. Filliben. “Addressing the Amorphous Content Issue in Quantitative Phase Analysis: The Certification of NIST SRM 676a.” Acta Crystallographica A 67 (2011): 357–367. doi:10.1107/S0108767311014565.
Related Rapid Analytical guidance: XRF Analysis of Ceramics & Oxide Powders · XRF Analysis of Ores, Minerals & Concentrates · Unknown Material Identification by XRF · XRF Powder Analysis